LaTeX \LaTeX L A T E X
LaTeX \LaTeX L A T E X
上述这句话来自lshort,确实如此,LaTeX的表格需要用比较复杂的代码来书写,这是很困难的。但是如果我们能学会几个宏包的基本用法,画画基础的三线表等还是问题不大的。所以,这边文章就来谈谈我目前遇到的各类表格和相应的解决方式。
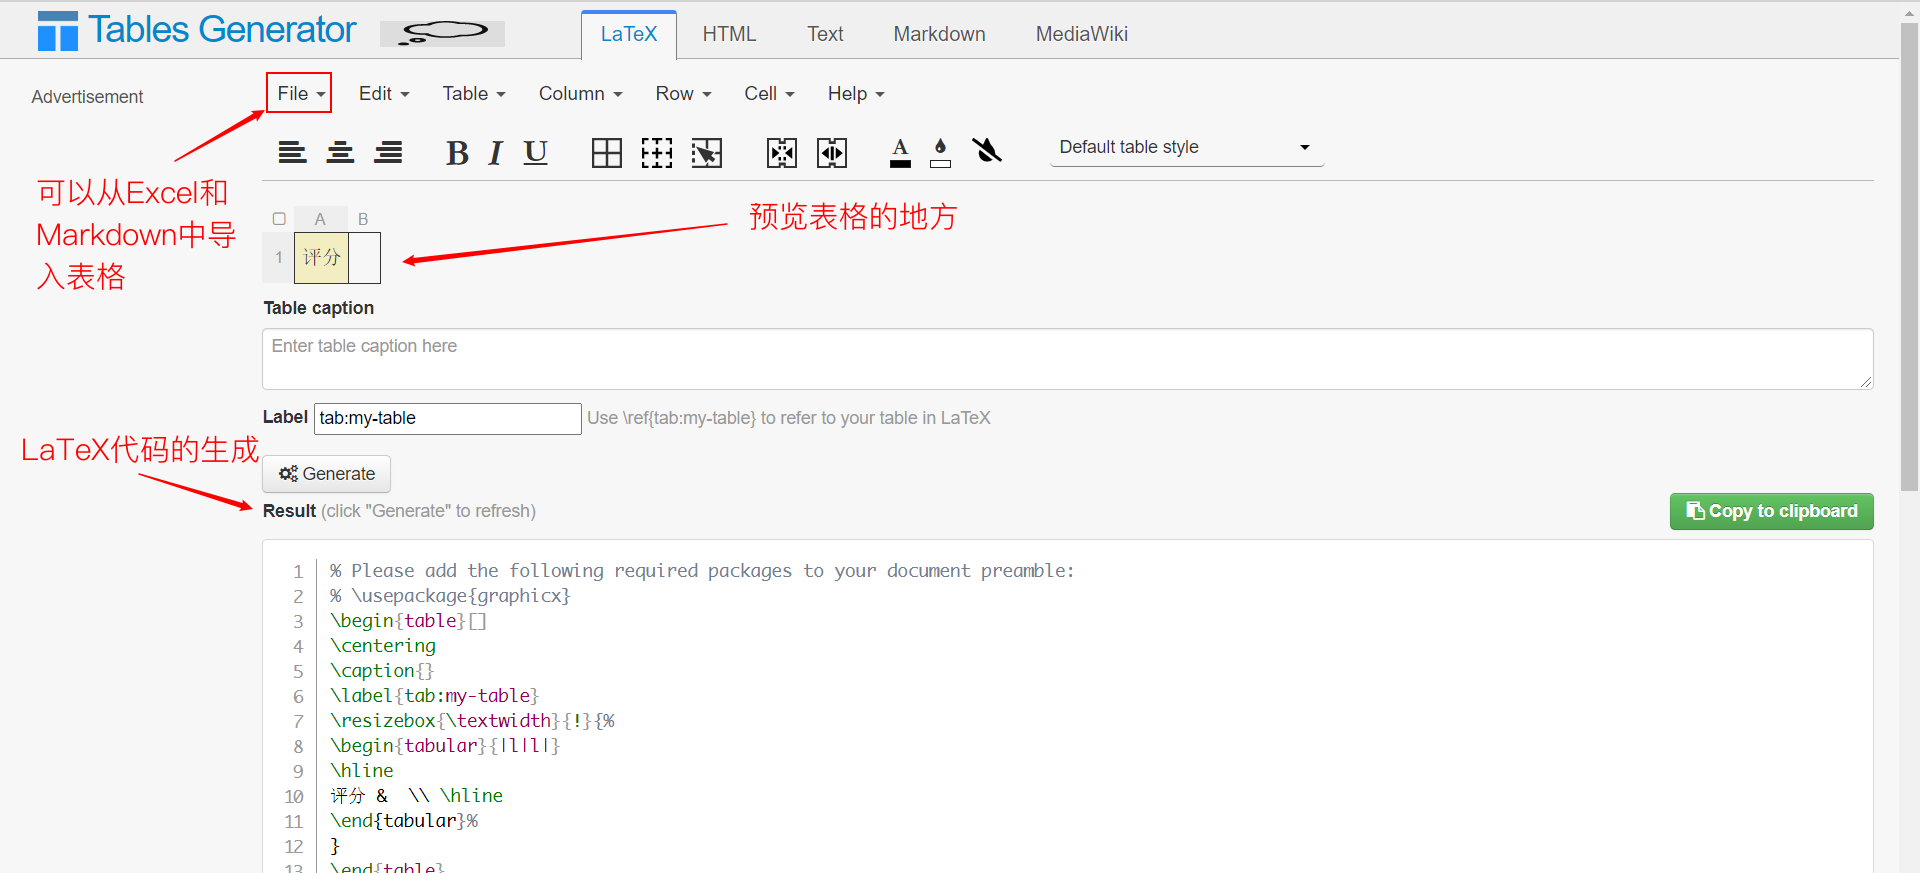
首先, 在最前面推荐一个网址👉Tables Generator ,用了它至少能节省你90%写表格的时间,也能解决90%左右的问题。 这是一个通过Excel和Markdown自动生成LaTeX表格的工具,他很强大。
但是为什么说只能解决90%的问题呢,因为这个表格的一些功能还是不够完善的。
它的caption和label需要单独调出并使用。
同时针对一些最基本的三线表,他表现得没有这么出彩,有时候间隔会比较混乱。
需要先手动调整文本的对齐方式,不想直接撸代码,cccc就四列居中了。
毕竟是网络上的资源,所以表格的操作还是没有Word好用。
当然以上这些只是吐槽,对于没有基础的小白来说,这个工具比直接写代码要好太多了。
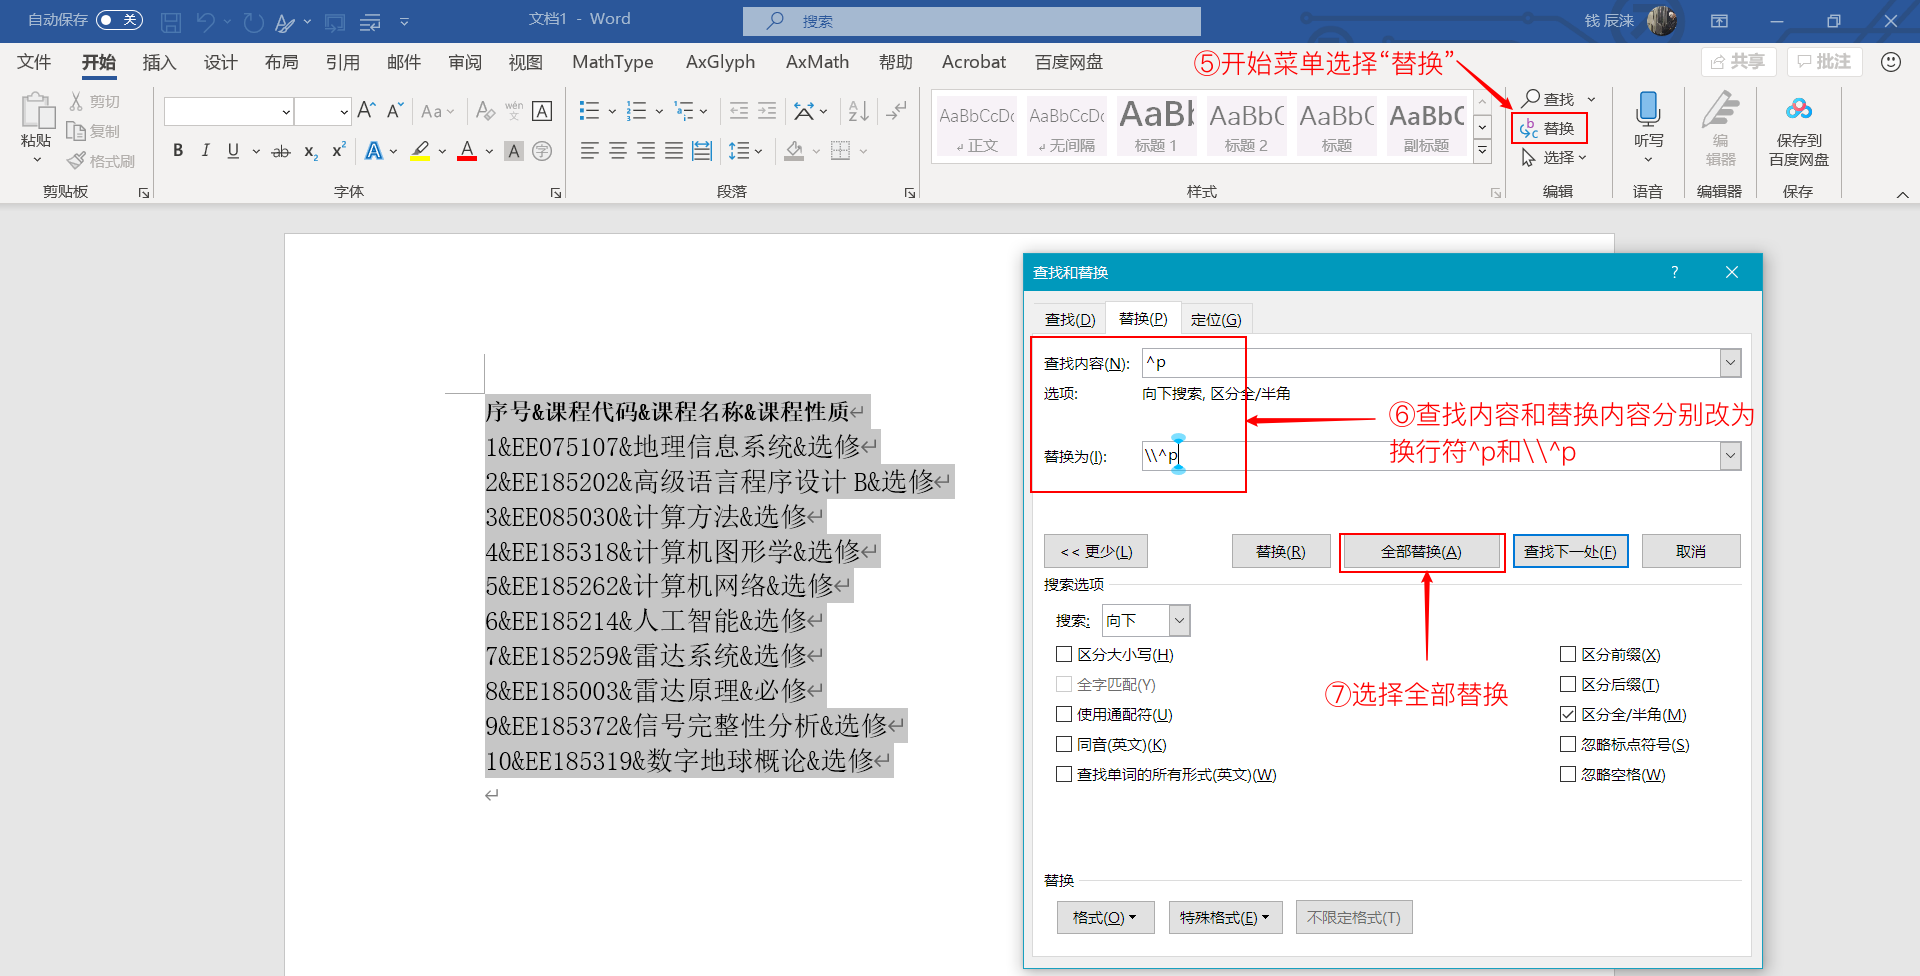
在LaTeX中,一般的我们用&作为间隔符号,用\\作为换行符,但是对于大批量的数据这样一个一个调整显然是很浪费时间的。所以这里有两个方法。我们可以利用Tables Generator或者Word来实现。
针对Tables Generator,我更倾向于把它作为一个数据转换器 ,把它当作一个将Excel和Markdown中表格数据转化为LaTeX \LaTeX L A T E X
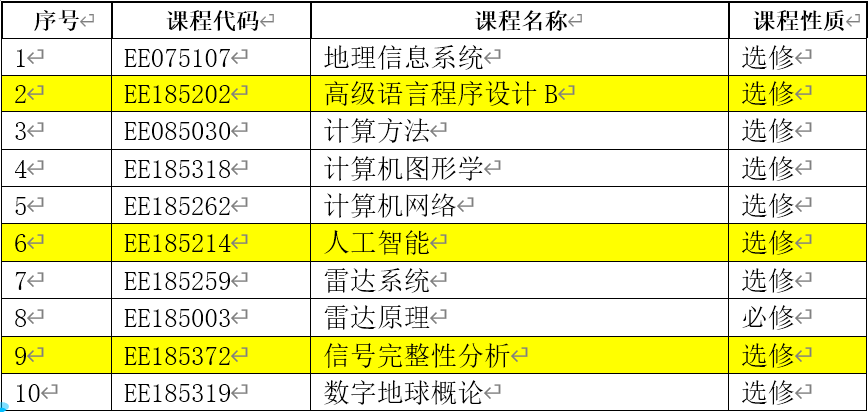
这个方法在我们有Excel或者Word表格时非常好用。这里做一个简单的介绍。
假设有如图所示的一张表格。
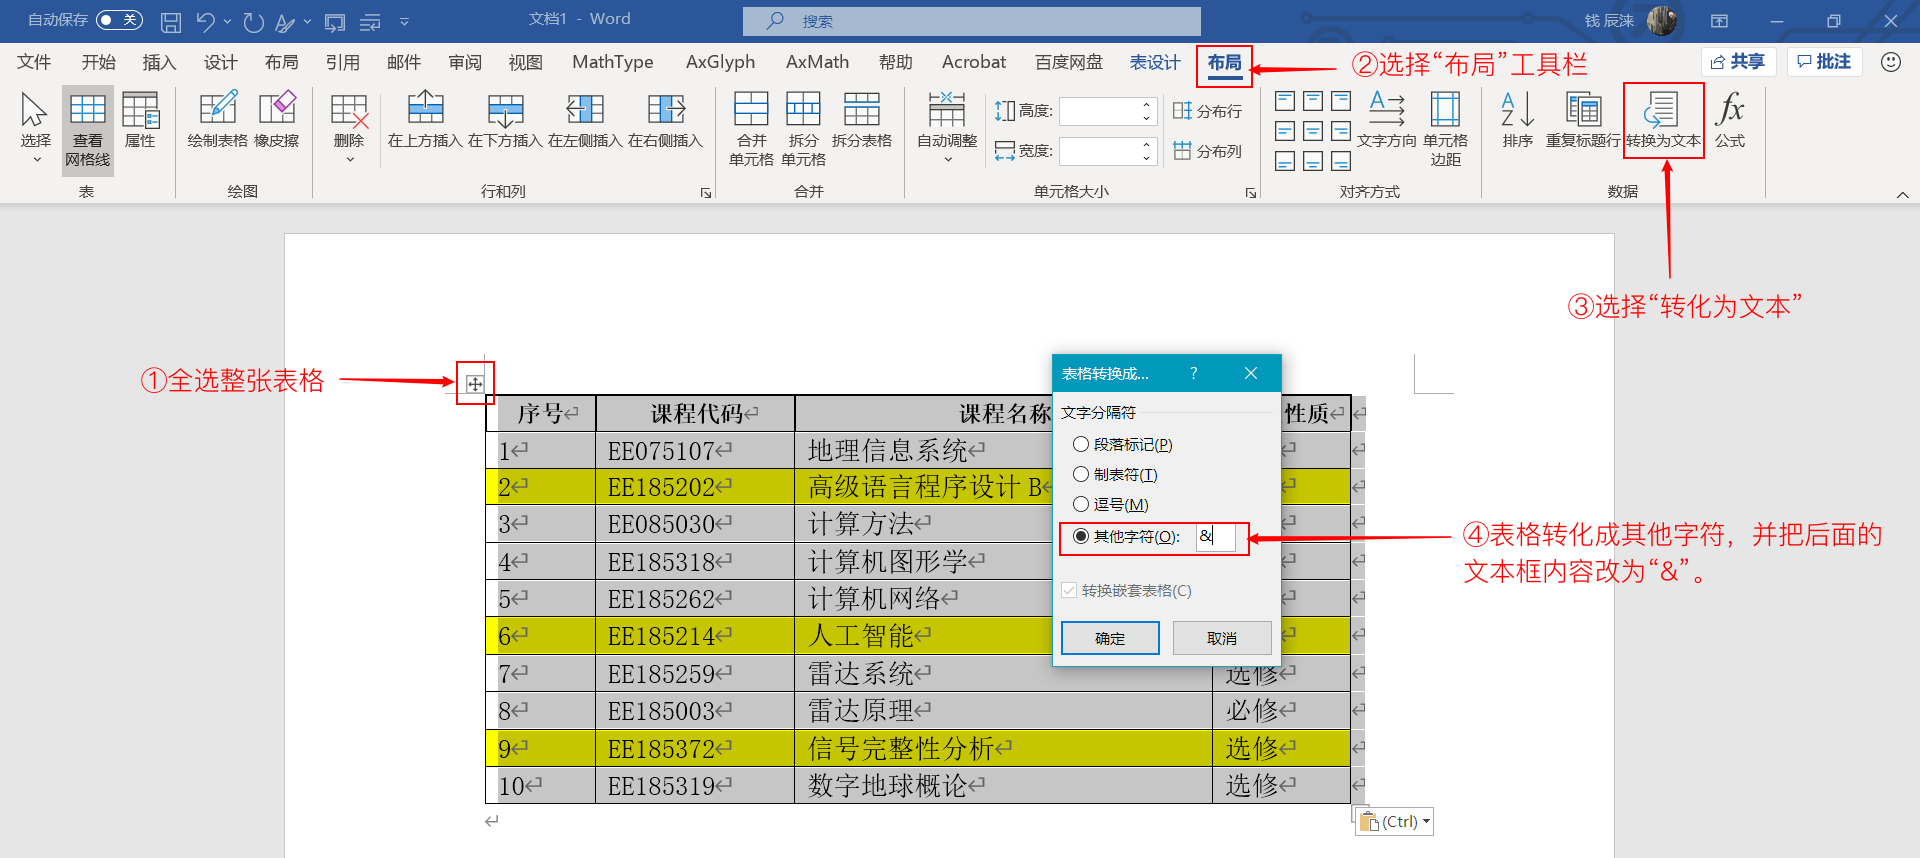
Step 1:将表格的间隔转化为&间隔。
全选整张表格
选择“布局”工具栏
选择“转化为文本”
表格转化为其他字符,设置为&
Step 2:换行字符\\的处理
最后获得的LaTeX的&间隔的数据如下
当部分情况下,最后一行不需要\\,这个可以视情况确定。
终于讲到关键的表格类型部分了。比较全面的表格操作可以查看lshort,这里只讲几类常用的表格。
在使用LaTeX的表格前我们当然需要先引入相应的宏包。这里给出我们美赛论文模板中(注意这边的引用是在sty文件中的引用,当放置到文中引用则应该改成\usepackage)引用的表格相关的宏包。
1 2 3 4 5 6 7 \RequirePackage {multirow} \RequirePackage {array} \RequirePackage {booktabs} \RequirePackage {tabularx} \RequirePackage {longtable} \RequirePackage {tabu} \RequirePackage {threeparttable}
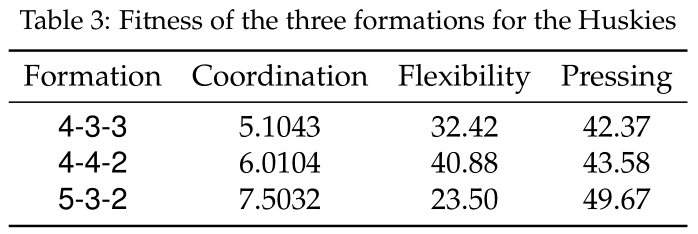
在科研论文中最常用的还是三线表,这里给出一个简单的例子。
1 2 3 4 5 6 7 8 9 10 11 12 13 14 \begin {table} [!htbp] \begin {center} \caption {Fitness of the three formations for the Huskies} \begin {tabular} {cccc} \toprule Formation & Coordination & Flexibility & Pressing\\ \midrule \textsf {4-3-3} &5.1043 &32.42 &42.37\\ \textsf {4-4-2} &6.0104 &40.88 &43.58\\ \textsf {5-3-2} &7.5032 &23.50 &49.67\\ \bottomrule \end {tabular} \label {tb:Fitness_formations} \end {center} \end {table}
首先,开启table环境,并将浮动体结构进行一定的设定,我一边选择的都是!htbp随便表格怎么浮动,但是有时候为了固定位置可以会引用float宏包中的浮动体设置H强制放置。
接着,开启center环境,使表格居中。
利用\caption语句添加表头。\label语句可以加在\caption后面也可以跟在表格后面。
接着,使用最基础的tabular环境制表,具体tabular的用法可以看lshort,在此不表。tabular环境使用*⟨column-spec⟩* 参数指定表格的列数以及每列的格式。基本的列格式见下表。
由于我们已经引用过booktabs宏包,所以可以使用其中三线,即顶端的\toprule,标题行和内容间的\midrule,表格结束的\bottomrule。值得注意的是,在这种表述情况下最后一行结束的地方务必出现\\,否则底端线的位置就在最后一行内容的后面了。
这就是最基本的三线表的操作。
列格式是一个比较重要的东西,这里我把lshort的部分内容附在这边,读者们可以参考。
表格中每行的单元格数目不能多于列格式里l/c/r/p 的总数(可以少于这个总数),否则出错。@格式可在单元格前后插入任意的文本,但同时它也消除了单元格前后额外添加的间距。@格式可以适当使用以充当“竖线”。特别地,@{}可直接用来消除单元格前后的间距:
1 2 3 4 5 6 \begin {tabular} {@{} r@{:}lr @{}}\hline 1 & 1 & one \\ 11 & 3 & eleven \\ \hline \end {tabular}
另外LaTeX还提供了简便的将格式参数重复的写法*{⟨n⟩}{⟨column-spec⟩},比如以下两种写法是等效的:
1 2 \begin {tabular} {|c|c|c|c|c|p{4em} |p{4em}|}\begin {tabular} {|{5} {c|} {2} {p{4em} |}}
有时需要为整列修饰格式,比如整列改变为粗体,如果每个单元格都加上\bfseries命令会比较麻烦。array 宏包提供了辅助格式>和<,用于给列格式前后加上修饰命令:
1 2 3 4 5 6 \begin {tabular} {>{\itshape} r<{*}l}\hline italic & normal \\ column & column \\ \hline \end {tabular}
辅助格式甚至支持插入\centering 等命令改变p列格式的对齐方式,一般还要加额外的命令\arraybackslash 以免出错。
1 2 3 4 5 6 \begin {tabular} {>{\centering \arraybackslash }p{9em}} \hline Some center-aligned long text. \\ \hline \end {tabular}
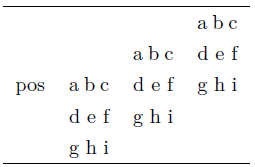
array 宏包还提供了类似p格式的m格式和b格式,三者分别在垂直方向上靠顶端对齐、居中以及底端对齐。
1 2 3 4 5 6 7 \newcommand \txt {a b c d e f g h i} \begin {tabular} {cp{2em} m{2em}b{2em}}\hline pos & \txt & \txt & \txt \\ \hline \end {tabular}
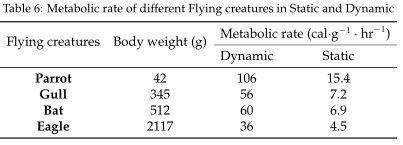
我们还经常会遇到标题内还有分类的三线表,比如下面这个例子。
1 2 3 4 5 6 7 8 9 10 11 12 13 14 15 16 17 18 \begin {table} [!htbp] \begin {center} \caption {Metabolic rate of different Flying creatures in Static and Dynamic} \begin {tabular} {cccc} \toprule \multirow {2} {*} {Flying creatures} & \multirow {2} {*} {Body weight (g)} &\multicolumn {2} {c} {Metabolic rate (cal$\cdot\text{g} ^{-1}\cdot \text {hr} ^{-1}$)}\\ \cmidrule {3-4} & & Dynamic & Static\\ \midrule \textbf {Parrot} & 42& 106 & 15.4\\ \textbf {Gull} & 345 &56 & 7.2\\ \textbf {Bat} & 512& 60 & 6.9\\ \textbf {Eagle} & 2117& 36 & 4.5\\ \bottomrule \end {tabular} \label {tb:Metabolic_rate} \end {center} \end {table}
这张表格和普通三线表有一大重要区别,这张表的标题行跨行了。这就导致了两个问题
跨行后跨越部分单元格的横线怎么画?
其余的标题文字怎么对齐?
由上述两个问题,这张表格比起基础三线表主要多了两个重要的语句。
合并单元格 ,包括行合并和列合并。
在LaTeX中横向合并单元格较为容易,直接使用\multicolumn{列数}{对齐方式}{内容}即可。而纵向合并单元格则需要用到multirow宏包,然后采用\multirow{列数}{宽度}{内容}。这两个语句仅在第二个命令有所区别。在\multirow中的宽度可以填*以使用自然宽度。
跨越部分单元格的横线 (在普通表格中一般采用\cline{⟨i⟩-⟨j⟩}实现,而在三线表中则利用\cmidrule{⟨i⟩-⟨j⟩}实现)
我们在标题行第一行结束后使用该语句即可画出相应的中间框线。
❗值得我们注意的是,虽然我们使第一行前两个单元格实现了行合并的操作,但是LaTeX的编译逻辑是一行一行编辑的,所以标题行一行行我们仍然需要四个数据3个&,即使前两个为空。& & Dynamic & Static\\
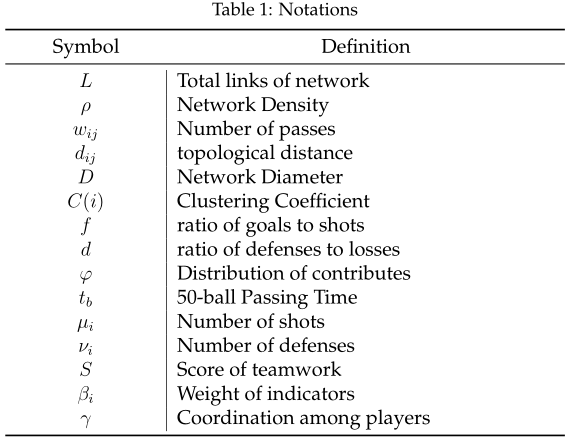
在lshort是不建议在三线表中添加其他框线的,但是有时候我们为了表明第一列和其他列的不同或是表明列与列之间的关系又不得不添加一条框线,所以我们在三线表的列格式中还是可能会使用到竖线|。最常见的当然就是在数模论文的符号说明中需要添加框线咯!比如下面这个例子。
1 2 3 4 5 6 7 8 9 10 11 12 13 14 15 16 17 18 19 20 21 22 23 24 25 26 27 \begin {table} [!htbp] \begin {center} \caption {Notations} \begin {tabular} {c|l} \toprule \multicolumn {1} {m{3cm} }{\centering Symbol} &\multicolumn {1} {m{8cm} }{\centering Definition}\\ \midrule $L$ & Total links of network \\ $\rho $ & Network Density \\ $w_{ij}$ & Number of passes\\ $d_{ij}$ & topological distance \\ $D$ & Network Diameter \\ $C(i)$ & Clustering Coefficient\\ $f$ & ratio of goals to shots\\ $d$ & ratio of defenses to losses\\ $\varphi $ & Distribution of contributes\\ $t_b$ &50-ball Passing Time\\ $\mu _i$ & Number of shots\\ $\nu _i$ & Number of defenses\\ $S$ & Score of teamwork\\ $\beta _i$ & Weight of indicators \\ $\gamma $ & Coordination among players\\ \bottomrule \end {tabular} \label {tb:notation} \end {center} \end {table}
❗针对带竖框线的三线表我们一般会遇到两个问题
**竖线断了。**在使用三线表时,添加的竖框线确实会在标题行和内容之间断开.如果不想断开,不妨不使用三线表的语句,转而使用最为普通的\hline。
竖线不见了 。由于这个竖框线是在列格式时候对于整个表格统一调整的,所以针对下面再次调整的表格样式,自然不会保留竖线。(这点也是我写这篇文章时候才想到的,美赛论文里搞得好丑的),比如我们可以把\multicolumn{1}{m{3cm}}{\centering Symbol}修订为\multicolumn{1}{m{3cm}|}{\centering Symbol},竖线就出现了。
在论文中我们还经常会遇到固定列宽的表格。有时候各个参数的关系确定的,但是他们的数据位数是不同的,这就导致自动匹配的表格列宽出现不一样的情况。那么如何来固定表格的列宽呢?在lshort中是这么说的:
在控制列宽方面,LaTeX \LaTeX L A T E X l/c/r 格式的列宽是由文字内容的自然宽度决定的,而p格式给定了列宽却不好控制对齐(可用array 宏包的辅助格式),更何况列与列之间通常还有间距,所以直接生成给定总宽度的表格并不容易。
在书中也告诉了我们解决的办法,那就是使用tabularx 宏包。书上给的例子是排版一个定宽的全框线表格。
1 2 3 4 5 6 \begin {tabularx} {14em} {|*{4}{>{\centering \arraybackslash }X|}} \hline A & B & C & D \\ \hline a & b & c & d \\ \hline \end {tabularx}
它引入了一个X列格式,类似p列格式,不过会根据表格总 宽度自动计算列宽,多个X列格式平均分配列宽。X列格式也可以用array 里的辅助格式修饰对齐方式,例如\centering(居中)、\raggedright (右对齐)、\raggedleft(左对齐)等。
在看一个例子,就是位数不同导致文字内容的自然宽度不同的例子。
1 2 3 4 5 6 7 8 9 10 11 12 13 \begin {table} [!htbp] \begin {center} \caption {Normalized results of raw data for each indicator} \begin {tabularx} {32em} {*{8}{>{\centering \arraybackslash }X}} \toprule \textit {C} \textsubscript {1} &\textit {C} \textsubscript {2} &\textit {C} \textsubscript {3} &\textit {C} \textsubscript {4} &\textit {C} \textsubscript {5} &\textit {C} \textsubscript {6} &\textit {C} \textsubscript {7} &\textit {C} \textsubscript {8} \\ \midrule 0.0833& 1.0& 0 &0.375& 1 &0.9326 &0.9067 &0 \\ \bottomrule \end {tabularx} \label {tb:Normalized_results} \end {center} \end {table}
这给出的就是一个完整的固定总宽三线表代码。
❗值得注意的是
\centering等对齐命令会破坏表格环境里\ 换行命令的定义,\arraybackslash用来恢复之。表格总宽一般设的不能太大,40em已经超出页边距了
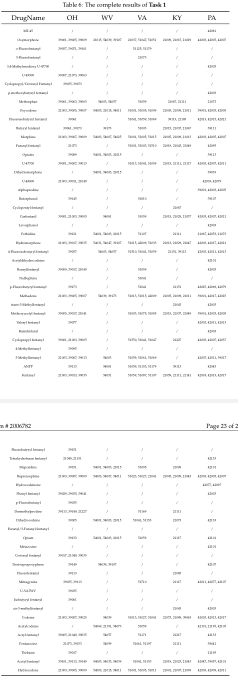
在部分论文中我们也不乏会出现跨多页的表格,我们通常把他放在附录中。这个例子,我们使用的是longtable环境。
1 2 3 4 5 6 7 8 9 10 11 12 13 14 15 \begin {center} \begin {longtable} {cccccc} \caption {The complete results of \textbf{Task 1} } \label {tab:xxx} \\ \toprule DrugName&OH&WV&VA&KY&PA\\ \midrule \tiny MT-45&\tiny /&\tiny /&\tiny /&\tiny /&\tiny 42081\\ \tiny Oxymorphone&\tiny 39001, 39005, 39009&\tiny 21015, 54039, 39107&\tiny 21037, 51047, 51051&\tiny 21009, 21015, 21029&\tiny 42003, 42005, 42007\\ \tiny o-Fluorofentanyl&\tiny 39057, 39071, 39101&\tiny /&\tiny 51125, 51179&\tiny /&\tiny /\\ \tiny 3-Fluorofentanyl&\tiny /&\tiny /&\tiny 21073&\tiny /&\tiny /\\ \bottomrule \end {longtable} \end {center}
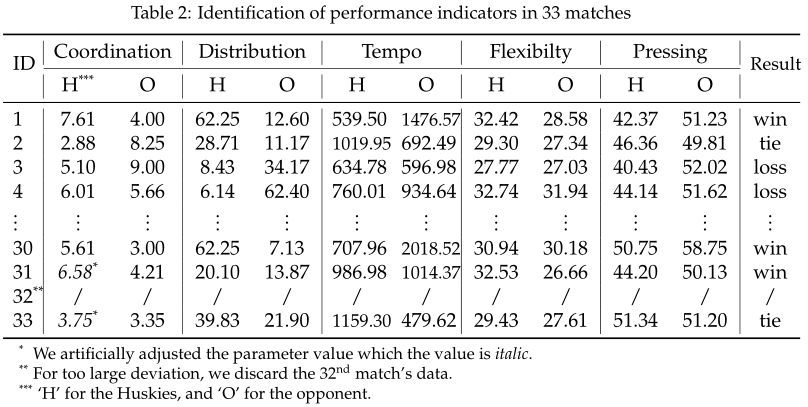
这里给出我们美赛论文中的一张表作为结尾。这张表基本包含了上述讲到的大部分知识点。还在表格中加入了注释部分。
1 2 3 4 5 6 7 8 9 10 11 12 13 14 15 16 17 18 19 20 21 22 23 24 25 26 27 28 29 30 \begin {table} [!htbp] \begin {center} \caption {Identification of performance indicators in 33 matches} \begin {threeparttable} \begin {tabularx} {40em} {p{1em} |*{2}{>{\centering \arraybackslash }X}|*{2}{>{\centering \arraybackslash }X}|*{2}{>{\centering \arraybackslash }X}|*{2}{>{\centering \arraybackslash }X}|*{2}{>{\centering \arraybackslash }X}|p{2em}} \toprule \multirow {2} {*} {ID} &\multicolumn {2} {c|} {Coordination} &\multicolumn {2} {c|} {Distribution} &\multicolumn {2} {c|} {Tempo} &\multicolumn {2} {c|} {Flexibilty} &\multicolumn {2} {c|} {Pressing} &\multirow {2} {*} {\small Result} \\ \cmidrule {2-11} &H\tnote {***} &O&H&O&H&O&H&O&H&O&\\ \midrule 1&7.61 &4.00 &62.25 &12.60 &539.50 &\small 1476.57 &32.42 &28.58 &42.37 &51.23 &\multicolumn {1} {c} {\centering win} \\ 2&2.88 &8.25 &28.71 &11.17 &\small 1019.95 &692.49 &29.30 &27.34 &46.36 &49.81 &\multicolumn {1} {c} {\centering tie} \\ 3&5.10 &9.00 &8.43 &34.17 &634.78 &596.98 &27.77 &27.03 &40.43 &52.02 &\multicolumn {1} {c} {\centering loss} \\ 4&6.01 &5.66 &6.14 &62.40 &760.01 &934.64 &32.74 &31.94 &44.14 &51.62 &\multicolumn {1} {c} {\centering loss} \\ $\vdots $ &$\vdots $ &$\vdots $ &$\vdots $ &$\vdots $ &$\vdots $ &$\vdots $ &$\vdots $ &$\vdots $ &$\vdots $ &$\vdots $ &\multicolumn {1} {c} {\centering $\vdots$} \\ 30&5.61 &3.00 &62.25 &7.13 &707.96 &\small 2018.52 &30.94 &30.18 &50.75 &58.75 &\multicolumn {1} {c} {\centering win} \\ 31&\textit {6.58} \tnote {*} &4.21 &20.10 &13.87 &986.98 &\small 1014.37 &32.53 &26.66 &44.20 &50.13 &\multicolumn {1} {c} {\centering win} \\ 32\tnote {**} &/&/&/&/&/&/&/&/&/&/&\multicolumn {1} {c} {\centering /} \\ 33&\textit {3.75} \tnote {*} &3.35 &39.83 &21.90 &\small 1159.30 &479.62 &29.43 &27.61 &51.34 &51.20 &\multicolumn {1} {c} {\centering tie} \\ \bottomrule \end {tabularx} \begin {tablenotes} \footnotesize \item [*] We artificially adjusted the parameter value which the value is \textit {italic} . \item [**] For too large deviation, we discard the 32\textsuperscript {nd} match's data. \item [***] `H' for the Huskies, and `O' for the opponent. \end {tablenotes} \end {threeparttable} \label {tb:performance_indicators} \end {center} \end {table}
为了加入表格注释部分,这里我们使用了一个threeparttable宏包。
\tnote用于表格中注释;tablenotes环境中使用带标签的有序列表表示注释。
我们可以通过下图看出其层次结构(画的很草率啊)
1
2
3
4
5
6
7
8
9
10
11
12
table环境(表格环境) │ └───center环境(整体居中) │ │ \caption{}(表格名称) │ │ \label{}(标签名称,用于引用) │ │ │ └───threeparttable环境(三段表,可以使用表格注释) │ │ │ └───tabularx环境(编辑定宽表格) | | │ └───tablenotes环境(编辑注释信息) end
CTEX 开发小组.一份(不太)简短的LaTeX 2 ε \LaTeX2\varepsilon L A T E X 2 ε https://mirrors.tuna.tsinghua.edu.cn/CTAN/info/lshort/chinese/lshort-zh-cn.pdf . 2018-09(最新的是2019-04的6.0.1版本)


![lshort1]()
![lshort2]()
![lshort3]()
![lshort4]()
